CVE Live Dashboard
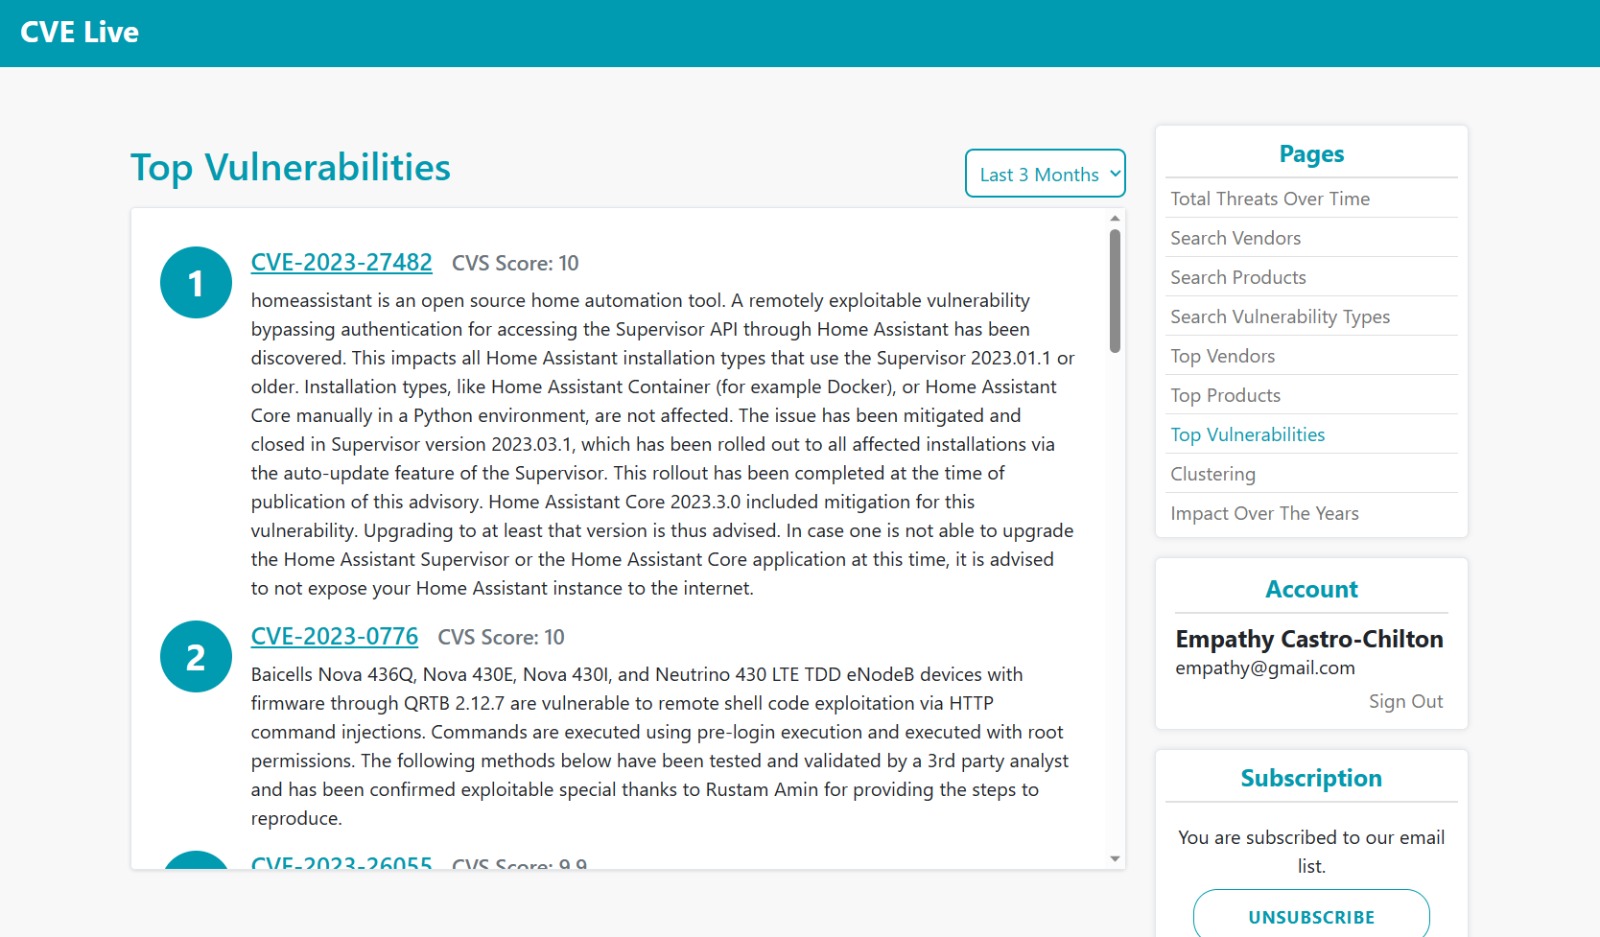
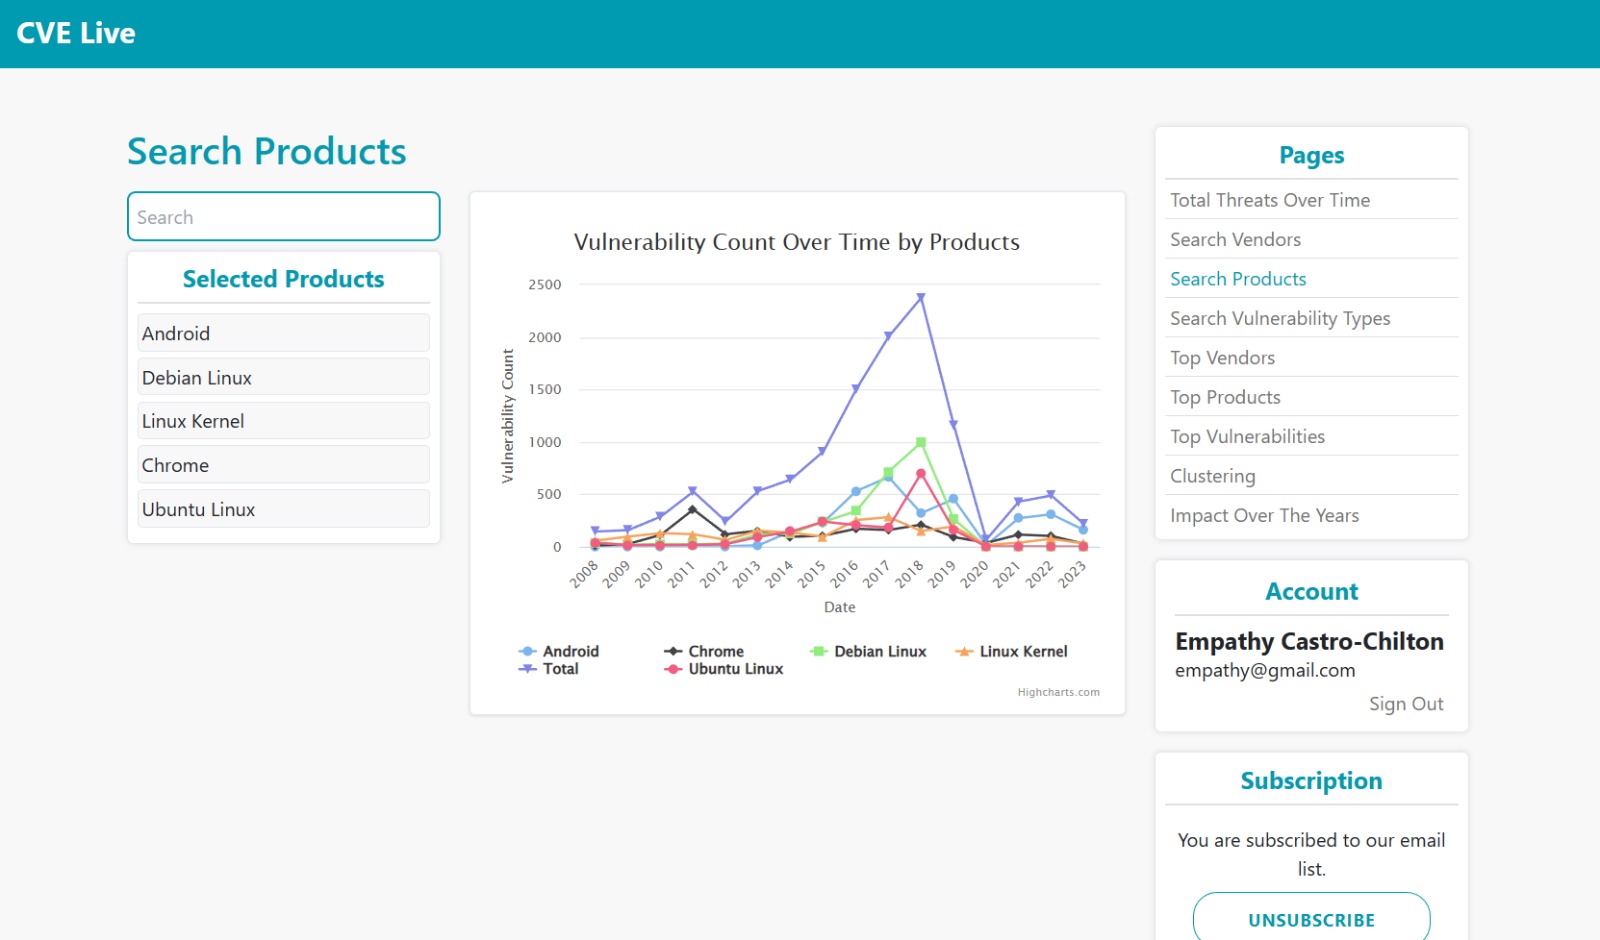
Created a web application as part of a class project to display live data from the National Vulnerability Database. The application features a dashboard with a map and charts to display the data. The data is updated every 24 hours. Users may subscribe to receive email notifications when new vulnerabilities are added to the database.
Features
- User authentication using up-to-date security practices, such as salt+hash passwords.
- Live graphs using data consumed from the OpenCVE API.
- Email notifications to inform subscribed users of newly discovered threats.


